Basic WiFi-based indoor location via Bayesian filters
Introduction
Indoor navigation is becoming a more sought-after utility for various mobile services and applications. Some of its applications include augmented reality, indoor robotics, targeted advertising, and more. The Received Signal Strength Indicator (RSSI) can be easily obtained in low cost equipments. However, due to the strong reflections and scattering conditions indoors, RSSI measurements are seriously attenuated by multipath of signal propagation. Therefore, it is a challenging task to estimate the position using RSSI measurements with the prevailing various fading effects. Therefore, this project proposes a basic Wi-Fi indoor location system by using Bayesian filters. It is hoped that this project will serve as a guide for those interested in indoor positioning. We must emphasize that that motion model was not considered for the development of this project due some difficulties using the smartphone sensors. However, the motion model will be considered in next version of this project.
This project was implemented as part of the course "Internet of Things: Communication and Localization", which was organized by the Faculty of Electric and Electronic Engineering at Universidad Nacional de Ingeniería (Peru) and conducted by PhD Marco Zúñiga Zamalloa from Delft University of Technology (Netherlands).
Overview
The procedure for the implementation of the indoor localization system is as follows:
1. Division of our area into cells.
2. Implementation of the app to perform Wi-Fi scan and capture.
3. Take samples at each cell and obtain one RSSI table per cell.
4. Division of the RSSI data into training and testing sets.
5. Clean the training RSSI datasets by using Gaussian curves.
6. Perform analysis of Bayesian filters offline.
7. Construction of confusion matrix.
8. Implementation of the app for localization.
9. Test the app in online in the cells.
Steps 2 and 8 were implemented in Android Studio IDE using Java 7 language. Steps 4, 5 and 6 were implemented using Python 2.7. A diagram of the system is shown in Fig 1.
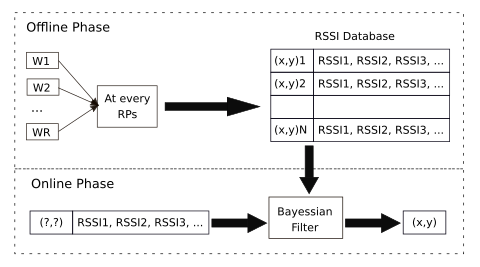
Figure 1: Diagram of the system
System description
1. Division of our area into cells:
We consider each room as a cell. But due the difficulty to find a larger number of rooms and APs, we only consider four rooms and two APs for purposes of this project. However, the procedure is the same for a larger number of rooms and APs. Fig 2. depicts the distributions of rooms and APs as well as its dimensions.
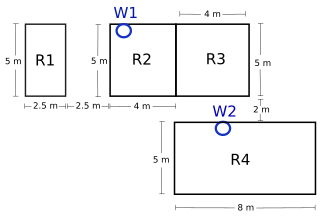
Figure 2: Distributions of rooms (R) and routers (W)
2. Implementation of the app to perform Wi-Fi scan and capture:
We implemented a Android application to perform Wi-Fi scan (for all the APs we extract SSID/MAC/RSSI) and Wi-Fi capture (for only "pre-defined" APs we extract SSID/MAC/RSSI) each time a buttom is pressed. Such "pre-defined" APs are those that are stable access points and SSIDs with an unique MAC addresses. The captured RSSI values at each room are saved in a .txt file in the smartphone. In addition to this, we implemented the app in Android Studio IDE using Java 7 language.
3. Take samples at each cell and obtain one RSSI table per cell:
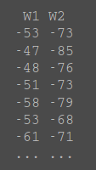
Using the Android app for Wi-Fi scan and capture, we took 100 samples of RSSI values in every room. The captures in each room were taken by us starting in the centre of the room and then moving to different positions inside the room. To obtain a robust system, the RSSI samples were taken at different times during a day, both at night and during the day. After capturing step, we obtained one RSSI table per room and each one was saved in the smartphone as .txt file. Therefore, we obtained four files: R1.txt, R2.txt, R3.txt and R4.txt. For instance, the "R1.txt" file is composed by:
4. Division of the RSSI data into training and testing sets:
After capturing the RSSI values in .txt files, we upload the files from the smartphone to our PC. In order to perform analysis of Bayesian filters offline we need training and testing datasets. So, we first randomly shuffle the samples in each .txt file, and then divide it into 80% for training (80 sampels) and 20% (20 samples) for testing. The training and testing datasets were saved under different folders for future analysis of Bayesian filters.
5. Clean the training RSSI datasets by using Gaussian curves:
Using the training RSSI dataset we calculate the normalized histograms (for each AP and room) in the range of RSSI values: [-100,-99,...,-11,-10]. However, since original training RSSI database is composed by a limited number of samples (affectd by reflections and scattering), the calculated histograms are composed by misssing RSSI values and noisy histogram values., see Fig. 3.
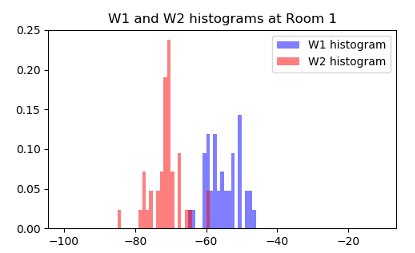
Figure 3: Original histograms
Many papers concerning indoor location, based on RSSI measurement, assume its Gaussian probability density function (PDF). This is partially excused by relation to PDF of radio-receiver's noise and/or together with influence of AWGN (average white Gaussian noise) radio-channel which is generally modelled by normal PDF. Therefore, we clean our original histograms by approximating each histogram to a Gaussian PDF. The next image shows the formulation of a Gaussian PDF, which is defined by two parameters: mu (mean) and sigma (standard deviation).
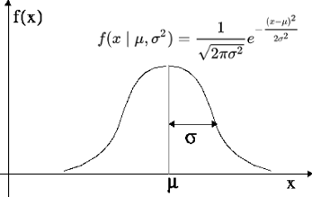
Figure 4: Description of Gaussian pdf
Fig. 5 shows the original histograms and the cleaned histograms (Gaussians histograms). As figure shows, our original histograms can be well approximated by Gaussians PFDs. This new distribution fills the missing values of the RSSI histogram and modify the values which were disturbed by strong reflections and scattering conditions. Therefore, after clean our normalized histograms, we obtained a new dataset composed only by the normalized Gaussian histograms.
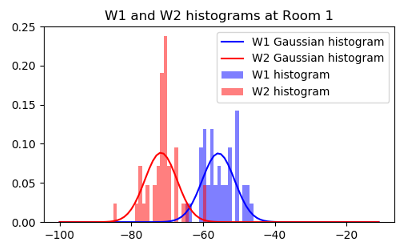
Figure 5: Original and cleaned histograms
6. Perform analysis of Bayesian filters offline:
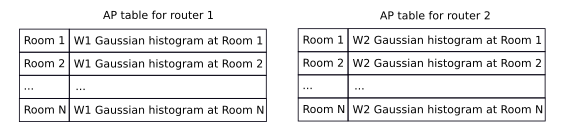
Before to perform analysis of the Bayesian filters, we constructed one AP table for each access point. Each AP table will be composed by joining the values of the Gaussian histograms of different rooms with the same AP. Next tables show how they are composed:
In order to predict the accuracy of our system, first we analyze the model offline. This means that the performance of the localization system is carried out on a PC using training and testing datasets.
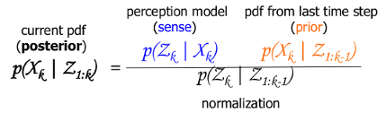
We assume a mobile device of interest located at a two-dimensional Cartesian plane. The used position algorithm was based on Bayes filter, which is able to estimate the posterior state based on sense and prior knowledge. In other words, the idea of Bayesian static localization is to estimate the posterior p(xk|zk) with only the current measurement. Using the Bayes’ rule, we get:
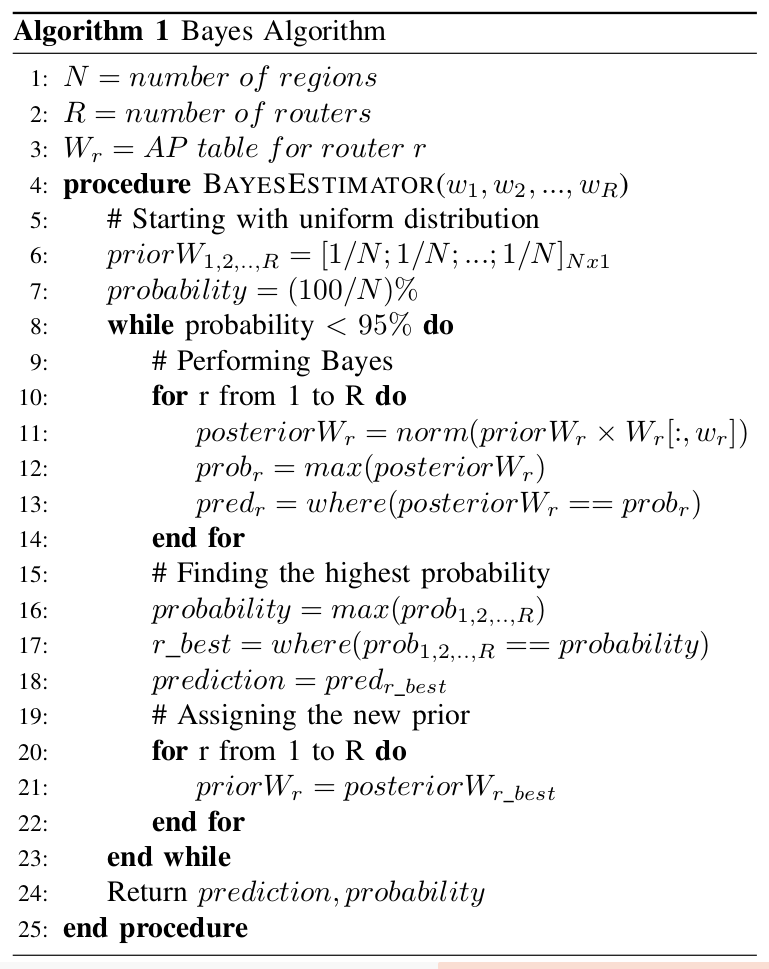
For this project, which considers four rooms and two APs, the pseudocode for the implementation of the Bayes-based position algorithm (used for the online model too) is as follows:
7. Construction of confusion matrix:
To evaluate the performance of the indoor localization system we used the Bayes prediction algorithm in the testing dataset. The results were summarized on a confusion matrix, which is a specific table layout that allows us easily visualize the performance of our prediction system, see Fig. 6. In this matrix, each column represents the instances in a predicted class while each row represents the instances in an actual class. In addition to confusion matrix, the overall accuracy of our Bayes prediction algorithm is 95.65%.
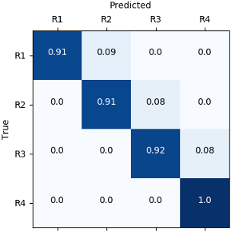
Figure 6: Confusion matrix
8. Implementation of the app for localization:
The Bayes prediciton algorithm described in step 6 is implemented on an Android device by using Android Studio SDK and Java 7 language. This algorithm takes as input the captured RSSI values (of the router 1 and router 2) and return the predicted room. We use the application developed in step 2 as the basis for the implementation of the app for localization, it means that we modified the previous app by adding the Bayes algorithm.
9. Test the app in online in the cells:
The app for localization developed at previous step was installed on a J2 Android Smarphone (with Android verion 6.0.1). Then, we tested the app at different positions inside different rooms, and verified if the developed localization system works properly. As expected, we verified that the system correctly predicted the locations for almost all positions inside different rooms. Some results are show in Fig. 7. As we can see, all tests conducted in each room correctly predict the location with an accuracy above 97%. However, we noticed that since we didn't implemented motion model, we obtained some wrong predictions while we used the application on move.
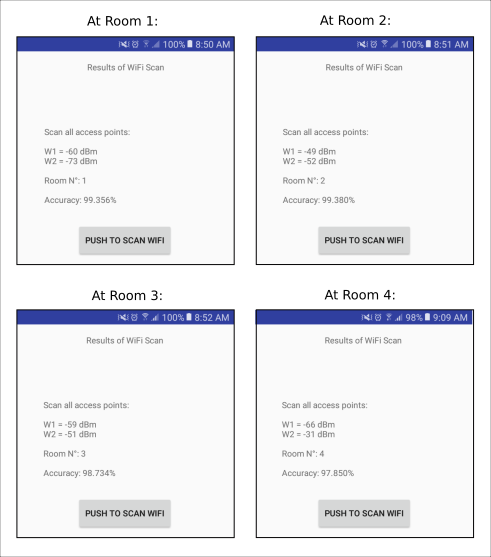
Figure 7: Online results on a Android smartphone
Conclusions
The implemented system was designed to predict the indoor localization by using Wi-Fi received signal strength. The used position algorithm is based on Bayes filter, wich is capable to estimate the posterior state based on sense and prior knowledge. Field tests showed that the proposed method was effective for indoor location of between four rooms. However, some wrong predictions are obtained while used the algorithm on move. Future work consists in add motion model and avoid these wrong predictions.